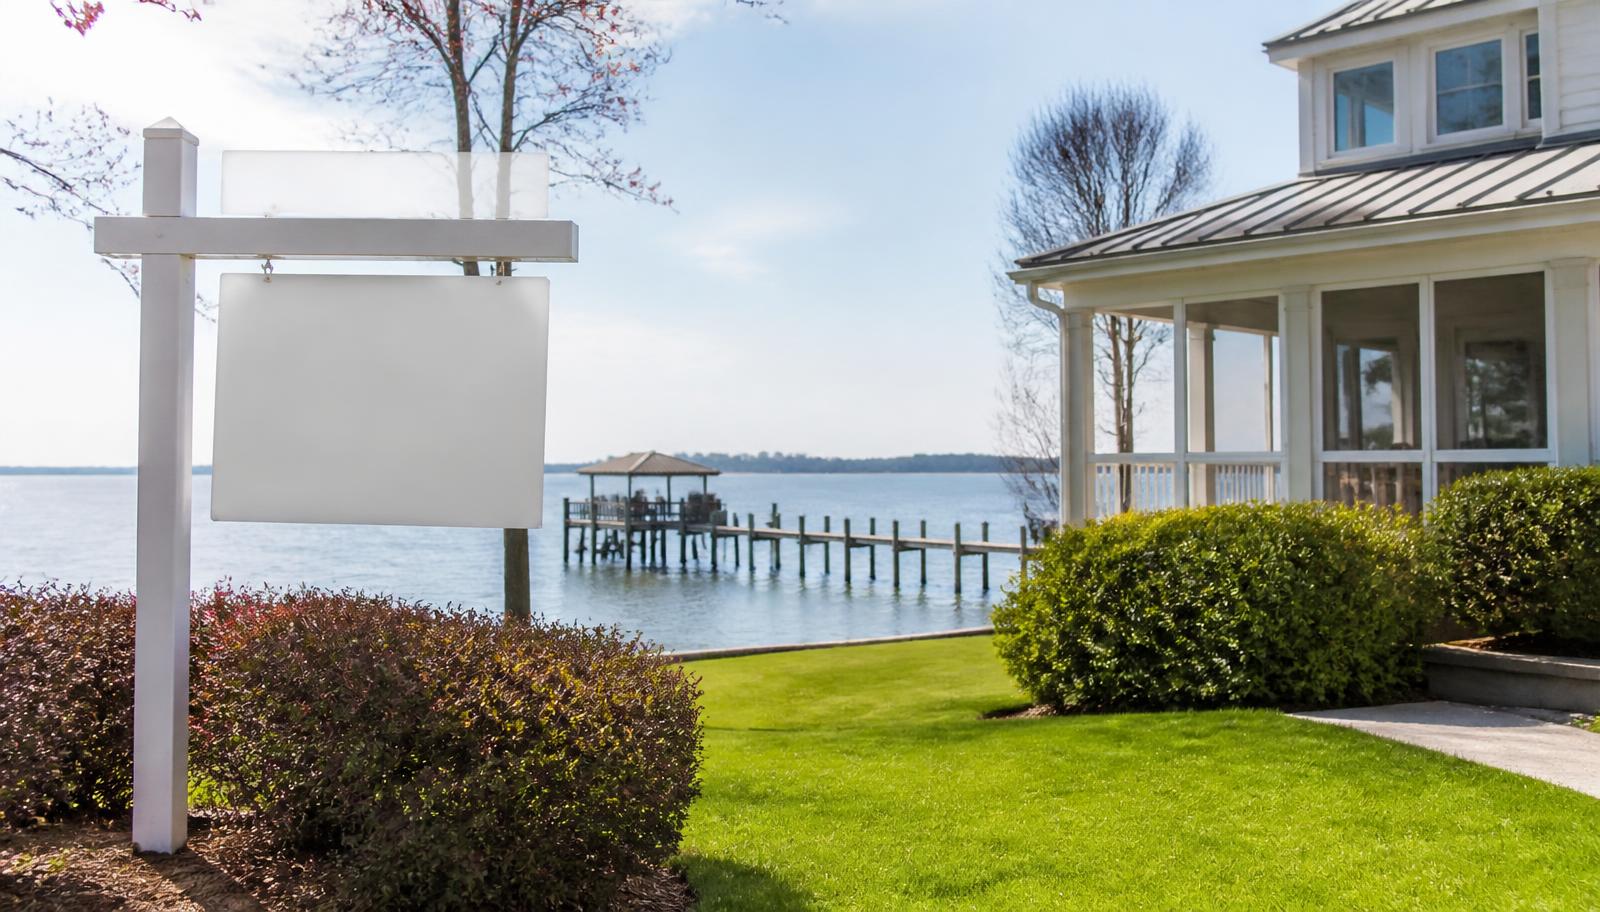
Winter quarter set the tone for the year — light inventory, disciplined pricing, and the first signs of relocation buyer momentum that would define spring.
This is the Q1 2026 edition of our waterfront estates coverage, preserved as a historical record of where the segment stood at the close of that quarter. Figures were accurate to that period and have not been restated. For the position as it stands today, read the current waterfront estates report (Q2 2026).
Q1 closed nine waterfront estates above $2M — the strongest opening quarter since 2022. Buyers who had paused through late 2025 returned with conviction, often touring three properties before submitting.
The Sanctuary's southern peninsula produced the quarter's highest sale at $4.2M. Off-market activity remained brisk: at least four estates traded privately before reaching MLS.
Sellers held firm on price. Concessions averaged under 1.5% of list — the tightest reading in two years.
How to read this report
Every figure on this page describes the waterfront estates segment of the Lake Wylie basin during Q1 2026 — not the county as a whole and not the broader Charlotte metro. That distinction matters, because a segment this narrow moves on its own supply. A handful of closings in a quarter can swing a median by six figures, which is why months of supply and days on market are the more stable indicators here than price alone.
Comparables are shown without street addresses. A meaningful share of activity at this level of the market transacts privately, and the properties listed are included for pattern rather than for identification: size, community, price per square foot and time on market together describe how the quarter behaved far better than any single sale does.
Percentage changes are year over year rather than quarter over quarter, which strips out the seasonality that dominates a lake market — spring listing surges, the summer selling window, and the winter lull when dockage and water views photograph poorly. Read a single quarter against the same quarter a year earlier, then read the trend across the archive below.
Selected Q1 2026 Sales
| Property | Community | Beds / Baths | Sqft | Sale Price | $/Sqft | DOM |
|---|---|---|---|---|---|---|
| Confidential — Sanctuary South | The Sanctuary | 5 / 5.5 | 6,980 | $4,200,000 | $602 | 41 |
| Confidential — River Hills Cove | River Hills | 4 / 4.5 | 5,420 | $2,985,000 | $551 | 68 |
| Confidential — Tega Cay Point | Tega Cay | 4 / 4 | 4,860 | $2,395,000 | $493 | 52 |
Looking Ahead
Spring should bring a measured release of inventory as owners who delayed 2025 listings come to market. We expect Q2 to outperform Q1 on volume but compress on days-on-market.
How we read the waterfront estates segment
The figures on this page are drawn from Canopy MLS closings in the Lake Wylie footprint — Belmont, Cramerton, Tega Cay, Lake Wylie, River Hills, and the unincorporated waterfront on both sides of the state line — reconciled against private off-market activity our team handles directly. Where comparables include pre-listed or pocket transactions, those are flagged in our internal data set and folded into the medians only when terms and timing make them genuinely comparable. We do not include rentals, fractional ownership, or estate sales conducted under court timeline pressure; those compress price discovery in ways that distort the segment.
Days-on-market for the waterfront estates tier behaves differently than for the broader Charlotte MSA, and the gap has widened over the past four quarters. Inventory enters and exits this segment in small batches — sometimes a single closing moves the median — which is why we publish the comparables table in full rather than a single summary statistic. Readers should weigh the spread of the underlying transactions, not just the median, when calibrating expectations for their own buy or sell decision.
Outlook commentary reflects what we are hearing in real listing appointments and offer negotiations this quarter, not a forecast model. The Lake Wylie waterfront is a thin market by national standards; lender behavior, dock-permit timing, and the seasonal rhythm of out-of-state relocation traffic all swing harder here than in deeper urban segments. We update this report on a quarterly cadence and re-cut the comparables every time a meaningful closing posts.